 Ferrite
Debugging and logs
A page may look wrong. A site may not open. The app may freeze. This page shows how to find out what the page or the engine said about it. It also says what to send when you ask for help. Ferrite keeps a console and a request log for each tab. It keeps a log file for runs without a terminal. A script gathers everything into one zip. Some words here are new. Words we use explains them.
Which build has this
The log file is in the build published on 2026-10-02 (commit f4ed744). DevTools, the crash banner and the log-collection script are newer. They are not in that build yet. To use them, build from source (Run it from source). The screenshots here were rendered on Linux.
DevTools#
DevTools is the panel for developers. It shows what a page and the engine report. You can open it in three ways. Press Cmd+Opt+I on macOS or Ctrl+Shift+I elsewhere. Press Cmd/Ctrl+J. Or use the menu (Developer tools). It is a bottom drawer with three tabs. Counts show on the tab labels. Drag its top edge to resize it.
F12 does not open DevTools. It opens the Audit panel. That panel shows the model-call timeline and the security log. In the security log, each entry is tied to the one before it. If you use F12 from habit in Chrome, you will see something else. Whether F12 should open DevTools is an open decision.
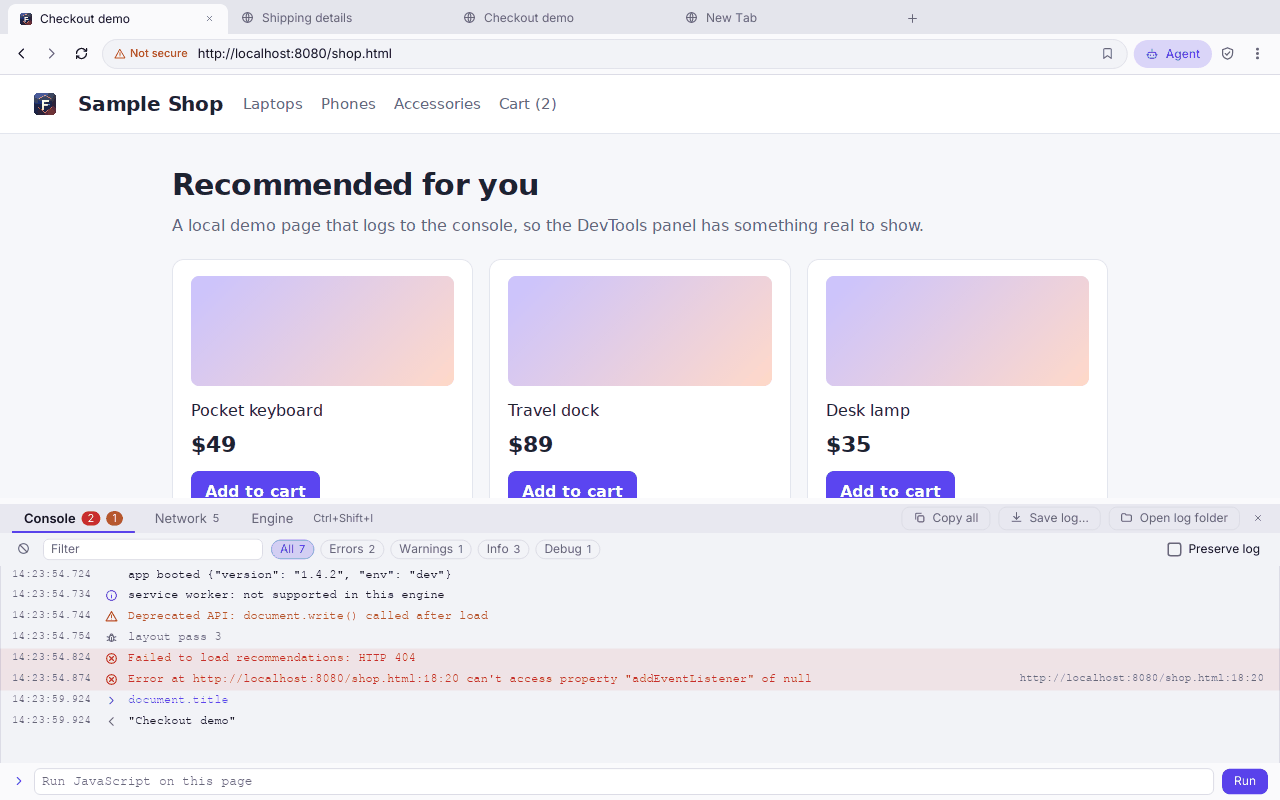
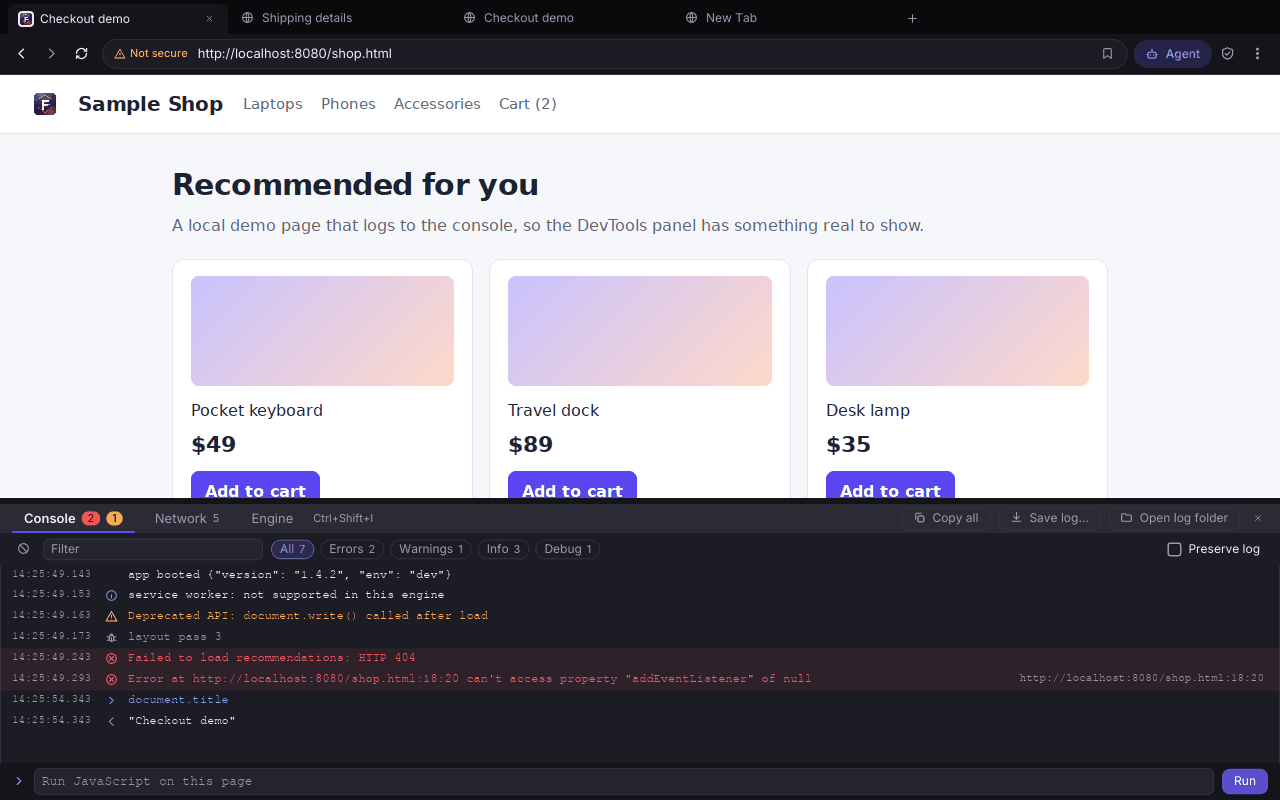
page_shot). The typed document.title row and its result are sample state.Console#
- Every message that the active tab's page printed, at every level (log, info, warn, error, debug). Also uncaught exceptions, which carry the file, line and column. Each tab has its own log.
- A filter box, level chips with counts (All, Errors, Warnings, Info, Debug) and a Preserve log checkbox. Without the checkbox, going to a new page starts the log again. With it, the log is kept and the new page is marked.
- Identical messages in a row fold into one row with a count. Long messages fold to a few lines with Show more.
- A prompt, Run JavaScript on this page. Type an expression and press Enter or Run. ↑ and ↓ recall earlier input (the last 100). This is you running script in the page, not the agent.
- Limits: at most 5,000 rows per tab, 4,000 characters per message and 8 MiB of message text per tab. The oldest rows go first.
Network#
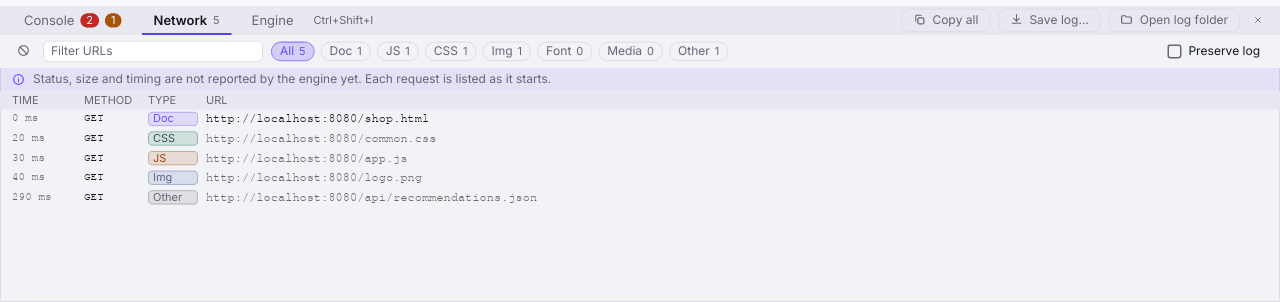
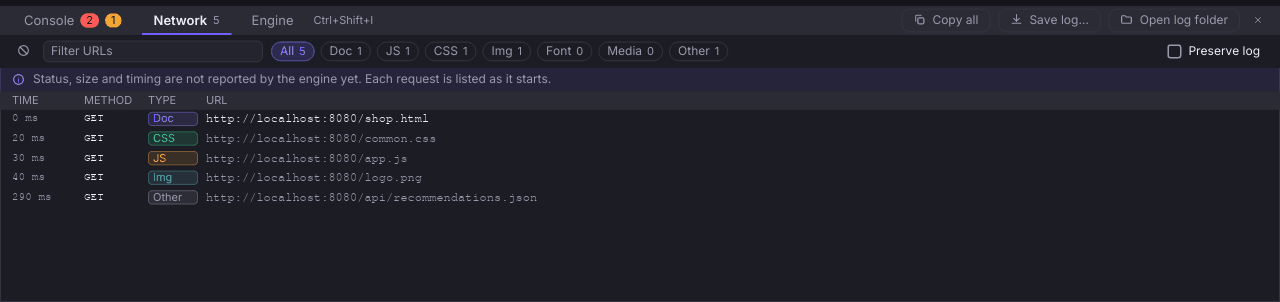
The tab lists each request that the page made, when it starts. A row shows the relative time, method, type and URL. There is a filter box and there are type chips (Doc, JS, CSS, Img, Font, Media, Other). fetch() and XHR requests fall under Other.
What the Network tab cannot tell you
When a request finishes, its size and time are filled in from the page's own Resource Timing. A size marked cache came from the cache. A dash means the request has not finished, or it came from another site that does not allow timing. There is no status code and no waterfall: the engine does not tell the browser the response itself, and the panel says so. A request that fails or returns 404 is listed like any other. For a failed load, look in the Console. That is where the page reports it.
Engine#
This tab lists two things from this session: panics on engine threads, and pages whose script thread died. A panic is a crash in the code. Each row shows the thread, the message and the location. It also has a backtrace that you can show or hide. A backtrace is a list of the code steps that led to the crash. The engine's own threads panic quietly. Without this tab, you only see a page that stops answering.
Header buttons#
- Copy all
- Copies everything in the current tab to the clipboard as text.
- Save log…
- Writes the current tab to
ferrite-<console|network|engine>-tab<N>-<date-time>.login the log folder (see below). - Open log folder
- Opens that folder in Finder, Explorer or your file manager.
Ferrite also writes console warnings and errors to the log file. They are lines like [console:error] tab 1: …. It writes at most 20 for each tick of the interface. So one noisy page cannot flood the file.
The log file#
You may start the browser from Finder, a Start menu or a launcher. Then it has no terminal, so its standard error output would go nowhere. Ferrite sends that output to a file instead. If you start Ferrite from a terminal, it prints to the terminal and writes no file.
| OS | Folder | Files |
|---|---|---|
| macOS | ~/Library/Logs/Ferrite/ (Console.app shows it under Log Reports) | ferrite.log, and the previous run as ferrite.previous.log |
| Linux | $XDG_STATE_HOME/ferrite/, otherwise ~/.local/state/ferrite/ | the same two names |
| Windows | %LOCALAPPDATA%\Ferrite\logs is where DevTools saves logs | No ferrite.log is written on Windows. In the current code, sending standard error to a file works on Unix only. Run Ferrite from a terminal to see the output. |
The file starts with a banner. The banner names the version, the OS, the architecture and the process id. Every panic carries a backtrace. (Ferrite sets RUST_BACKTRACE=1 for you if you have not set it.) Suppose the interface stops ticking for 8 seconds. Then one line says so (the UI has not responded for …). One more line appears when it recovers. When you close the window, the process ends within 3 seconds, whatever the engine is doing. If the process had to be forced to end, the log says so. Nobody knows whether this watchdog also covers Cmd+Q on macOS, which goes through the system menu.
On a new machine, look first for the renderer line and the WebGL line (see the renderer and WebGL). The renderer line says CPU rendering, because there is no GPU renderer. The WebGL line says whether pages get WebGL.
Collecting logs to send#
$ bash scripts/collect-logs.sh                                      # from a checkout
$ bash /Applications/Ferrite.app/Contents/Resources/collect-logs.sh  # from the macOS app
(Or run just collect-logs in a checkout.) The script writes one zip, ferrite-logs-<date-time>.zip. It puts the zip on your Desktop, or in your home folder if you have no Desktop. It prints the path. The zip contains:
ferrite.logandferrite.previous.log, or aNO-LOG.txtthat says there is no log.- On macOS, the three newest Ferrite crash reports from
~/Library/Logs/DiagnosticReports. - On macOS, if Ferrite is running right now, a 5-second stack sample of it. A stack sample shows what the app is doing. Run the script while the app is frozen.
system.txt. On macOS it has the OS version, hardware and display listing. Elsewhere it hasunameand the CPU.
Nothing is uploaded. But the log can contain page URLs and console errors. So read it before you send it. The script needs bash and zip. It does not support Windows. The sampling part works on macOS only. The bundled copy is in the macOS app only. Suppose Ferrite crashes on macOS (exit code 139). Then just crash-report prints the exception and the stack of the crashing thread from the newest report. It uses only Python's standard library.
A page that never stops loading#
Some pages paint fully but the stop button stays in the toolbar. You may also be unable to scroll or click. Ferrite writes two kinds of line to help.
- Load lines. The log has one
[ferrite-load]line for each step of a page's load:Started,HeadParsedandComplete. A page that never reachesCompleteshows how far it got. The stop button stays untilComplete. - A stuck script. Ferrite asks each page's script thread a trivial question every 2 seconds. It never waits for the answer. If there is no answer for 5 seconds, the Console tab shows this page's script has not answered, and the log shows the same as a
[console:warn]line. Scrolling and clicking go through that thread. A stuck script freezes them while the page still paints. An info line says when the page answers again.
While a page is stuck, open Activity Monitor and look at Ferrite's CPU. Near 100% means a script is busy. Near 0% means it is waiting for something. Then run collect-logs.sh in a second terminal. It includes a 5-second sample of the frozen app. (ferrite.log holds only the newest run. The run before it is ferrite.previous.log.) This was tested on Linux with a page that blocks its script for 9 seconds. It has not run on a Mac.
Reporting a page that does not work#
Send these things, most useful first:
- the address
- the Console and Engine tabs (Copy all)
- whether the page shows the crash banner
- the
[ferrite-render]line and the first lines of the log - the zip above
page_shot loads a page again without the app (see Run it from source).
Some pages still need your log
On the owner's Mac, GitHub now opens and Google shows a results page. But some pages never stopped loading, and the Google results page could not be scrolled or clicked. Three causes were found and fixed. The first was a WebGL panic (see the renderer and WebGL section). The second was icons that painted black on a dark theme. The third was an infinite loop in the engine's layout code. It was found from the collect-logs zip: the 5-second sample showed one script thread stuck inside one layout function. A page whose element sits inside a display: contents wrapper made it loop forever when a script observed that element with an IntersectionObserver that has an explicit root. A local test page froze the engine before the fix and loads in 20 ms after it. None of the three is confirmed on a Mac yet. Please try Google again with a build that has the fix.